Skip to content
-
Get Breaking News Alerts
Subscribe to SRKANALYTICS.COM Push Notifications and never miss important updates.
SRK Analytics SRK Analytics

Money Roar

  • Home
  • Business Insights
  • Market
  • Startup
  • Emerging Market
  • IPOs
  • Corporate Updates
  • facebook.com
  • twitter.com
  • t.me
  • instagram.com
  • youtube.com
Subscribe

trading indicators

  • Home
  • trading indicators
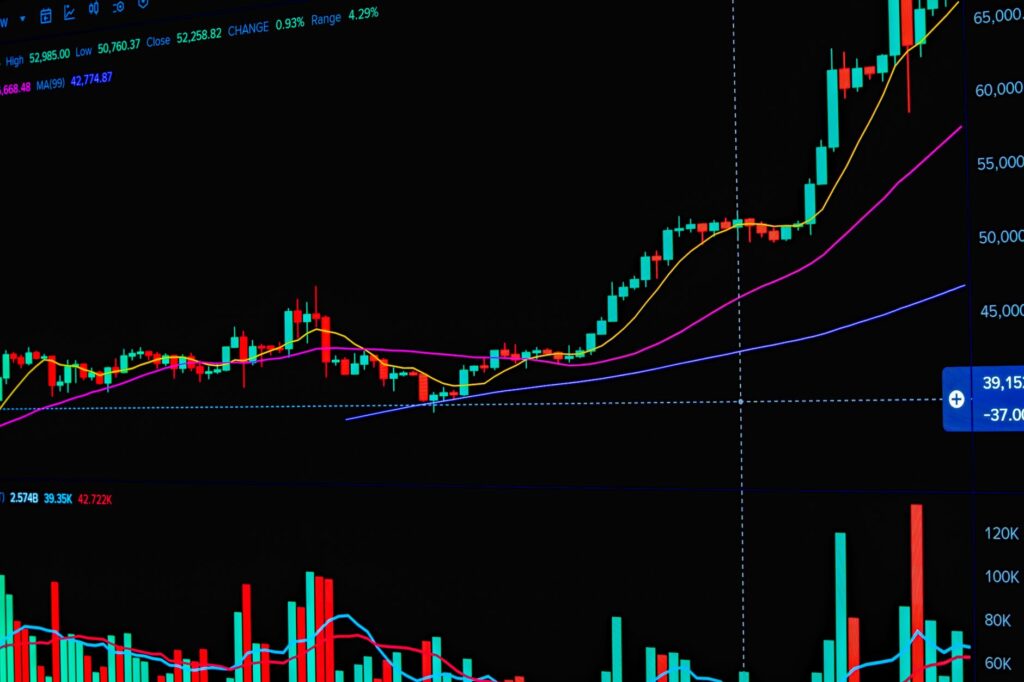
Detailed view of a financial stock market graph illustrating trends and analytics.
Posted inEmerging Market

Understanding the 200 Day DMA and Positive Stock Breakouts

Discover how traders use the 200 day moving average to identify positive stock breakouts and assess broader market trends.
Posted by Prasenjit Bhowmik September 24, 2026

Recent Posts

  • Power Metallic Unveils Maiden Resource at Lion Project
  • Saba Capital Management Acquires Shares in Gabelli Healthcare
  • Saba Capital Management Acquires Shares of Ellsworth Stock
  • U.S. Imposes New Sanctions on Iranian Airlines Amid Regional Conflict
  • Five Critical Areas Impacted As US Treasury Yields Approach 5 Percent

Recent Comments

No comments to show.

Archives

  • November 2026
  • October 2026
  • September 2026
  • August 2026
  • July 2026
  • June 2026

Categories

  • Business Insights
  • Corporate Updates
  • Economy
  • Emerging Market
  • Market
  • Startup
November 2026
M T W T F S S
 1
2345678
9101112131415
16171819202122
23242526272829
30  
« Oct    
Copyright 2026 — SRK Analytics. All rights reserved.
  • Home
  • Privacy Policy
  • Terms & Conditions
  • Disclaimer
  • Contact Us
  • About Us
Scroll to Top
Follow by Email
Facebook
fb-share-icon
X (Twitter)
Post on X
LinkedIn
Share
Instagram
Telegram
WhatsApp
THREADS

Website security powered by MilesWeb