

Understanding Market Trends Through Technical Indicators
Financial markets present a complex landscape for participants aiming to identify sustainable price movements. Among the numerous analytical tools available to market participants, the two hundred day moving average holds a prominent position. Traders and investors routinely monitor this specific metric to evaluate the overarching direction of a security over an extended period. By smoothing out daily price fluctuations, this indicator helps market participants filter out short-term market noise and focus on macro price action.
The Significance of the Daily Moving Average
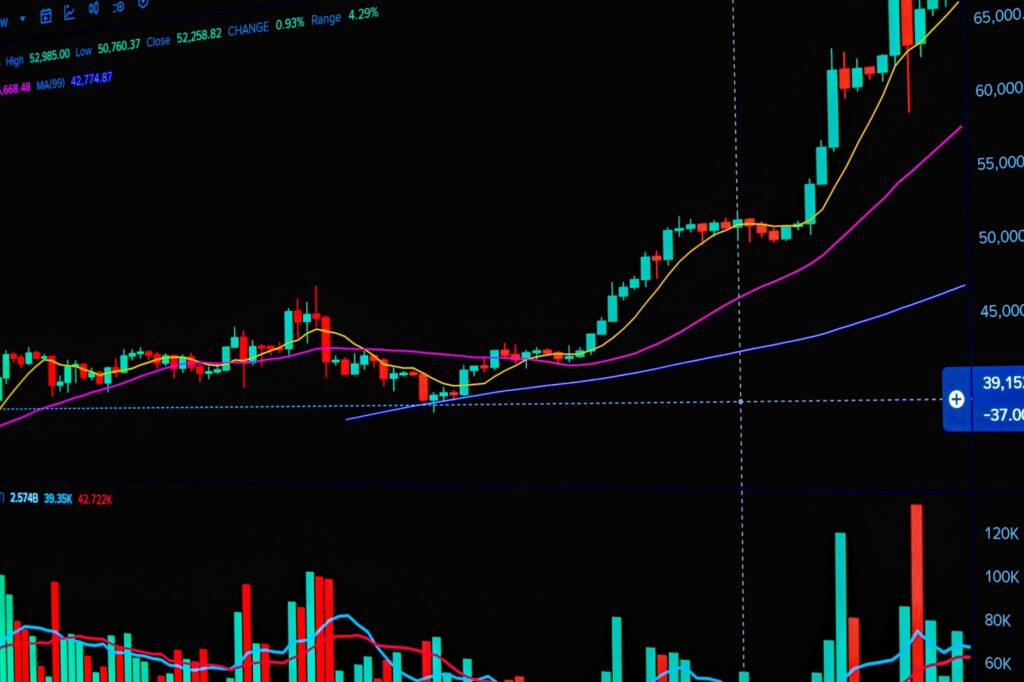
The two hundred day moving average functions as a dynamic benchmark that reflects the average closing price of an asset over the preceding two hundred trading sessions. Market analysts view this timeframe as a reliable gauge of long-term market sentiment. When a security consistently trades above this established moving average on a daily chart, market convention generally interprets the condition as a sign of a primary uptrend. Conversely, trading below this threshold often signals a bearish environment or a prolonged correction period.
Identifying Positive Breakouts
A critical moment for many active participants occurs when a security crosses above its two hundred day moving average. This technical event is frequently described as a positive breakout. Such a crossover suggests a potential shift in momentum, indicating that buyers are regaining control and pushing valuations higher relative to their historical long-term average. While no single indicator guarantees future performance, monitoring these crossovers provides market participants with a structured framework for identifying potential shifts in market leadership and momentum.
Practical Application for Market Participants
Incorporating moving averages into a broader analytical routine requires discipline and a comprehensive view of market conditions. Rather than relying solely on a single crossover signal, successful participants often combine moving average analysis with volume studies, fundamental research, and risk management strategies. This multi-layered approach helps confirm the validity of a breakout and reduces the likelihood of reacting to false signals. By maintaining a structured perspective on long-term trends, market participants can better navigate changing financial landscapes.