

Understanding Bullish Market Signals
Financial markets constantly provide technical indicators that help market participants gauge future price directions. When specific chart patterns emerge, they often capture the attention of technical analysts and active participants alike. On a specific trading session in early September, four prominent equities within the Nifty500 index exhibited powerful bullish momentum. These developments point toward sustained buying pressure and suggest that buyers maintained absolute control from the opening bell to the final close.
Spotlight on Finolex Cables
Among the standout performers identified during this market session was Finolex Cables. As a well-known name in its sector, price movements in this equity frequently attract significant attention from market observers. The technical formation observed on September 3 indicates that strong demand absorbed selling pressure seamlessly throughout the day. This type of price action often precedes a continuation of upward momentum, drawing keen interest from those tracking technical setups.
The Significance of the White Marubozu Pattern
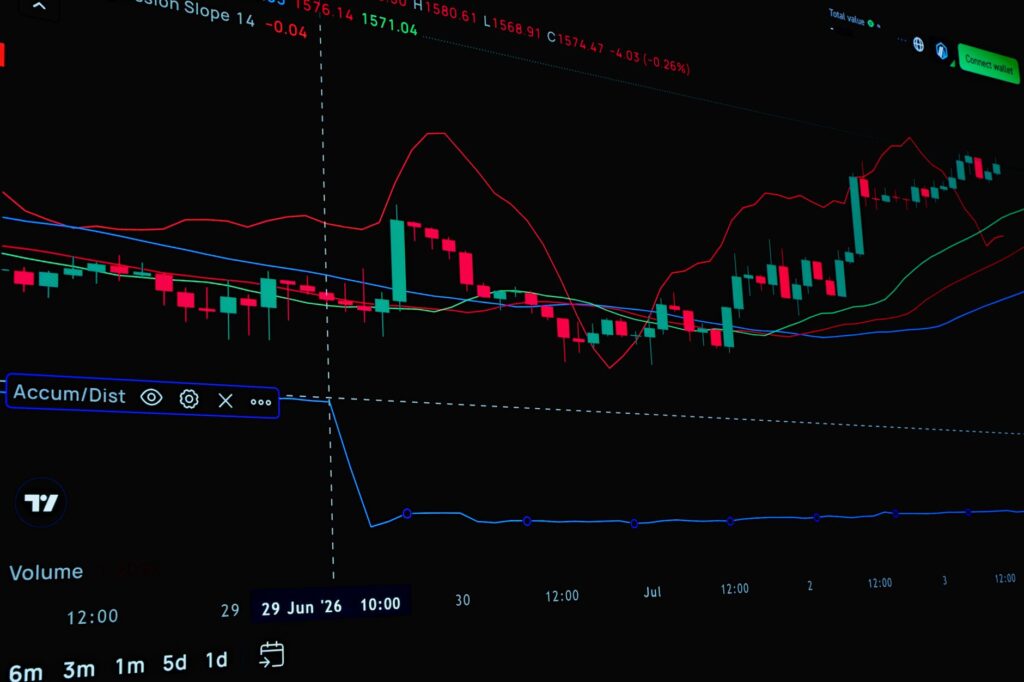
The technical phenomenon driving these observations is known as the White Marubozu candlestick pattern. This specific formation is characterized by a long body with little to no shadows or wicks at either the top or the bottom. In technical analysis, the absence of upper and lower wicks signifies that prices opened near the session low and closed near the session high, or essentially maintained a strong upward trajectory without retracing significantly. This pattern communicates a clear message regarding market sentiment, showing that buyers held the upper hand continuously and sellers failed to mount any meaningful resistance.
Broader Implications for the Nifty500 Index
While individual equities display unique price behaviors, clusters of similar technical patterns across multiple companies within a major index like the Nifty500 can offer broader insights. Observing four different entities flash identical bullish signals on the same day underscores a localized concentration of buying interest. Market analysts frequently monitor such occurrences to determine whether sector-specific strength or broader accumulation phases are taking place. Although technical signals do not guarantee future performance, they remain essential tools for mapping out potential trading opportunities and understanding prevailing market dynamics.
Navigating Technical Indicators Wisely
Interpreting candlestick patterns requires a comprehensive approach to risk management and market analysis. While formations like the White Marubozu highlight strong intraday momentum, prudent observers always consider broader market trends, volume levels, and macroeconomic factors before drawing final conclusions. As these four Nifty500 stocks continue to develop their respective price trajectories following the September 3 session, market participants will closely watch to see if the anticipated uptrend materializes into sustained longer-term growth.