
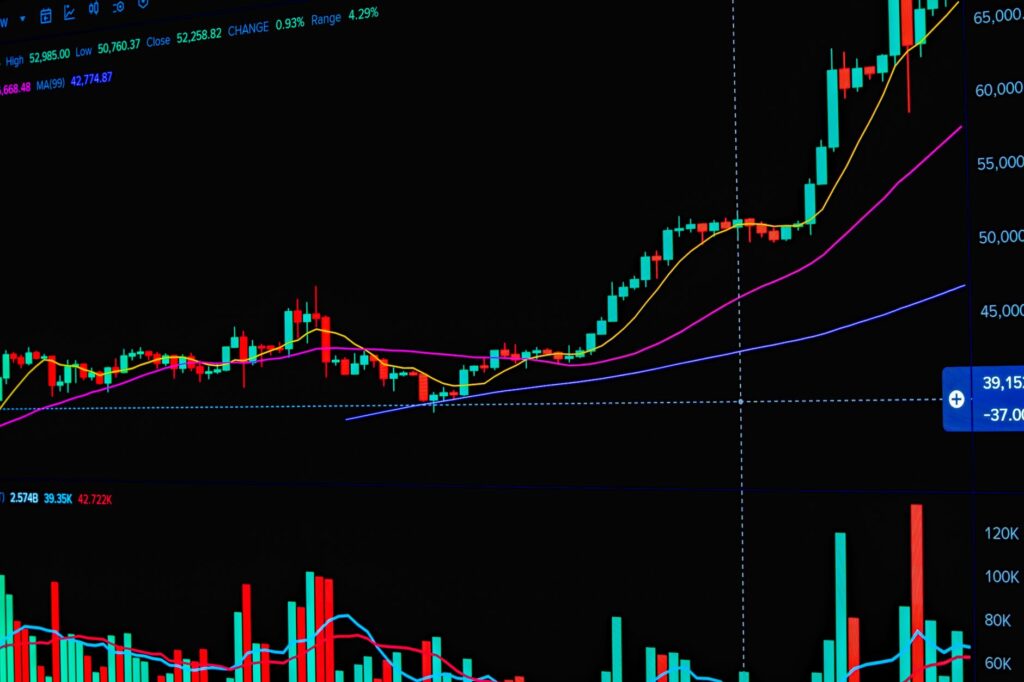

The 200 Day Moving Average
The 200-day simple moving average stands out as one of the most widely followed technical indicators in the financial markets. Market participants and analysts across the globe rely on this metric to gauge the long-term direction of a security. When analyzing a daily price chart, determining whether an equity trades above or below this specific threshold often provides critical insight into the prevailing market sentiment.
Defining the Long Term Trend
Financial theory suggests that price positioning relative to this key indicator dictates the broader trend structure. As long as a stock maintains a price above the 200-day moving average on the daily timeframe, market observers generally consider that asset to be in an overall uptrend. This sustained positioning above the historical mean signals enduring buyer interest and underlying economic strength within that specific corporate entity.
Significance of Moving Average Crosses
Equities that manage to push upward and cross above their long-term moving average frequently capture the attention of technical traders. Such a movement often represents a shift in momentum from a previous consolidation or downward phase into a new positive trend. Portfolio managers monitor these technical events closely to reassess their asset allocations and identify potential opportunities in the broader market.
Applying Technical Analysis Wisely
While technical indicators offer valuable frameworks for evaluating price action, prudent investors rarely rely on a single metric in isolation. Combining the 200-day moving average with volume analysis, fundamental research, and broader macroeconomic conditions creates a more robust investment strategy. Understanding these foundational concepts helps market participants navigate complex financial environments with greater clarity and discipline.